Monitor your entire IT infrastructure—networks, servers, applications, and cloud—from one dashboard. Get instant alerts, fix issues faster, and stop downtime before it happens.
One platform to monitor your entire IT infrastructure—from network devices to cloud services.
Routers, switches, firewalls, load balancers, and wireless access points
Windows, Linux, Unix—CPU, memory, disk, and hardware health
VMware, Hyper-V, and Citrix—host and guest performance
AWS, Azure, Google Cloud—instances, storage, and cloud health
NetFlow, sFlow, jFlow, packet sniffing, and traffic analysis
Microsoft 365, Exchange, SQL, IIS, Apache, and custom apps
SQL Server, MySQL, PostgreSQL, Oracle—queries and performance
Industrial sensors, SCADA, and operational technology devices
NAS, SAN, disk arrays—capacity, IOPS, and latency
Firewalls, IDS/IPS, VPN concentrators, and access logs
Temperature, humidity, UPS, and data center conditions
REST API, custom sensors, scripts, and any data source
Multiple agentless methods to gather metrics from any device—no software installation required on monitored systems.
Simple Network Management Protocol for network devices, switches, routers, and printers.
Windows Management Instrumentation for deep Windows server and workstation monitoring.
Analyze network traffic headers to identify bandwidth hogs and traffic patterns.
Collect flow data from routers and switches for detailed bandwidth and traffic analysis.
Secure Shell for Linux, Unix, and macOS systems—CPU, memory, disk, and custom scripts.
Query any API endpoint or run custom scripts to monitor virtually anything.
No software to install on target systems. PRTG uses industry-standard protocols to collect data remotely, reducing complexity and maintenance overhead.
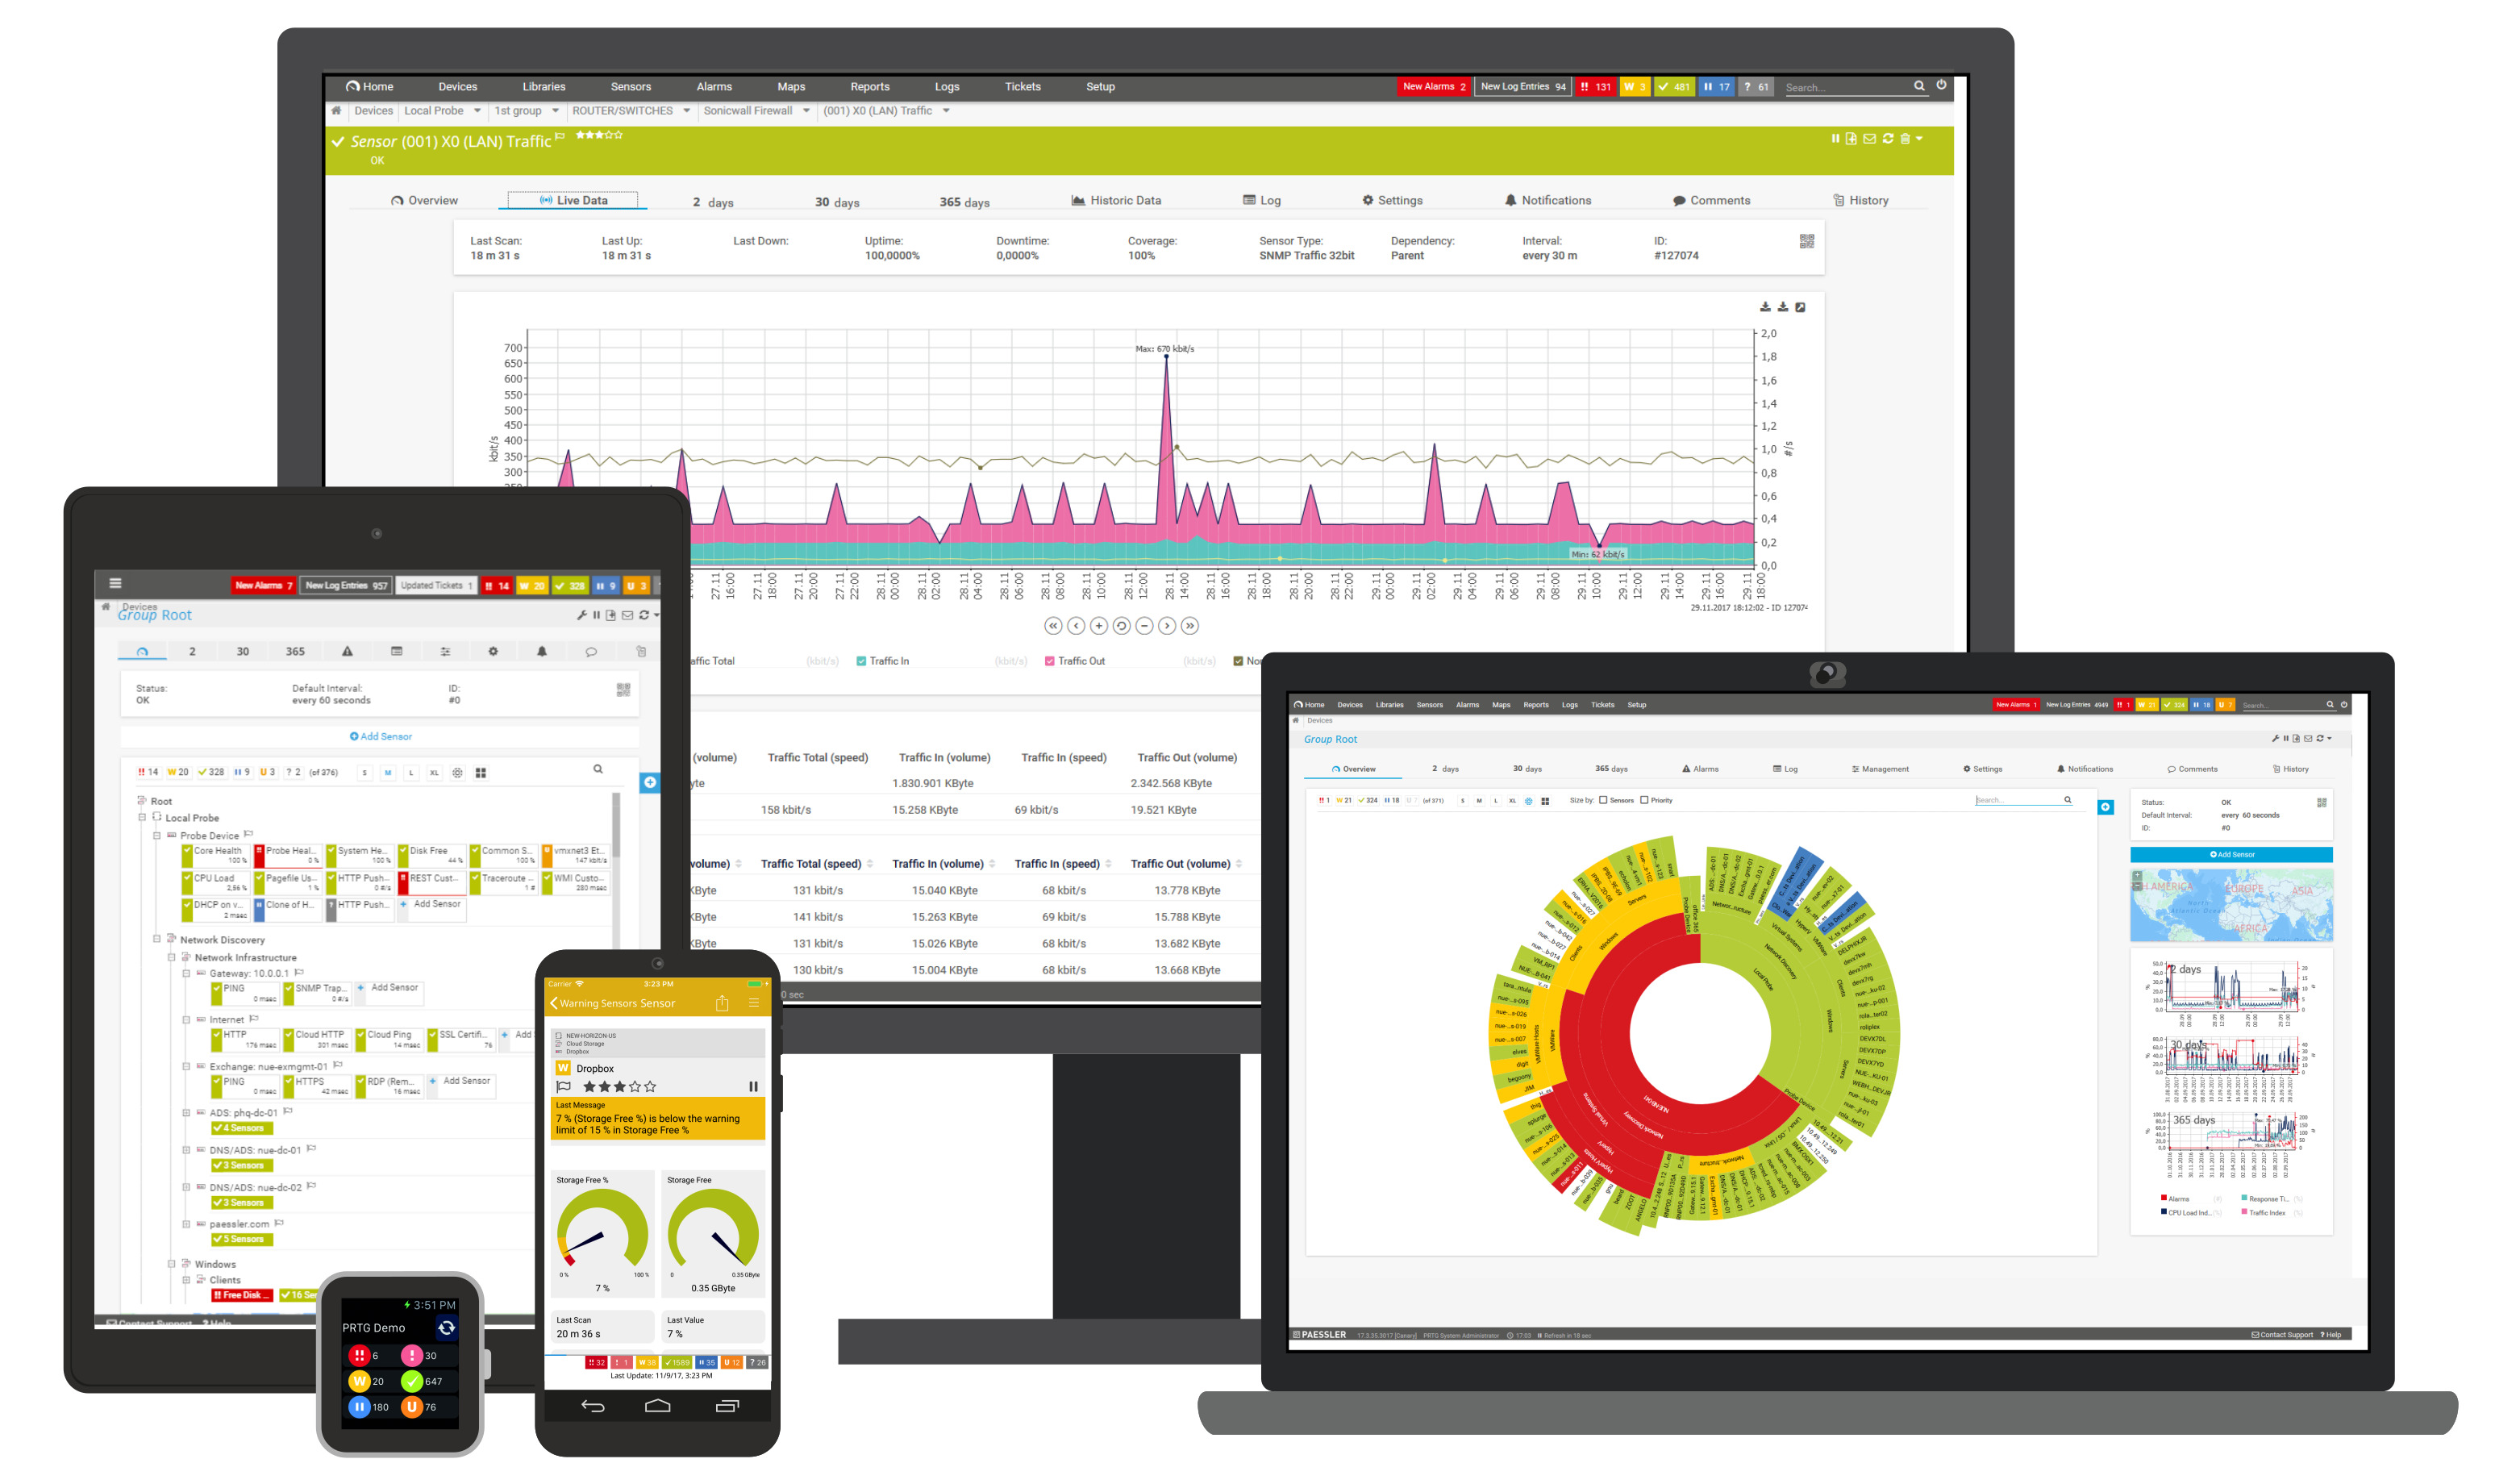
Experience the intuitive monitoring dashboard designed for IT teams who demand real-time visibility into their entire infrastructure.
Powerful features designed to save time, reduce alert fatigue, and keep your infrastructure running smoothly.
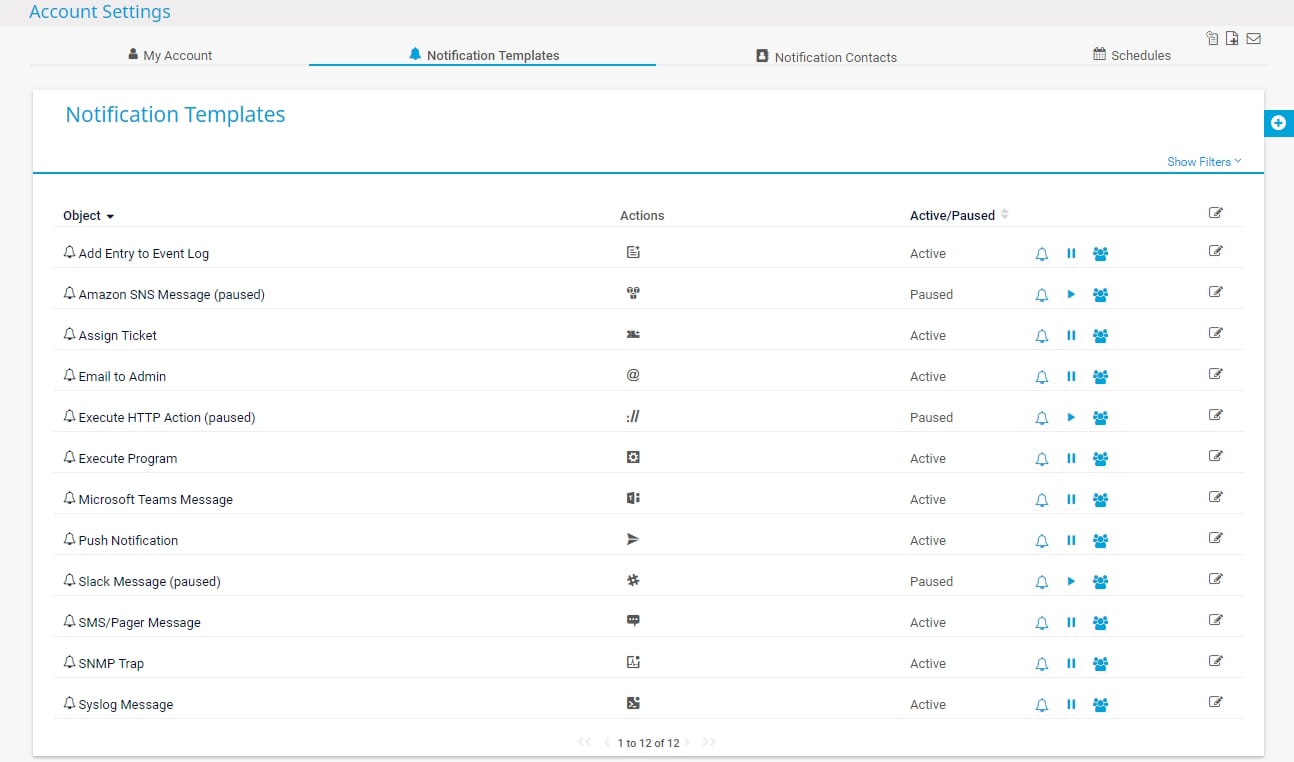
Get notified the way you want—email, SMS, Slack, Teams, or push notifications. Set thresholds, dependencies, and escalations so you only hear about what matters.
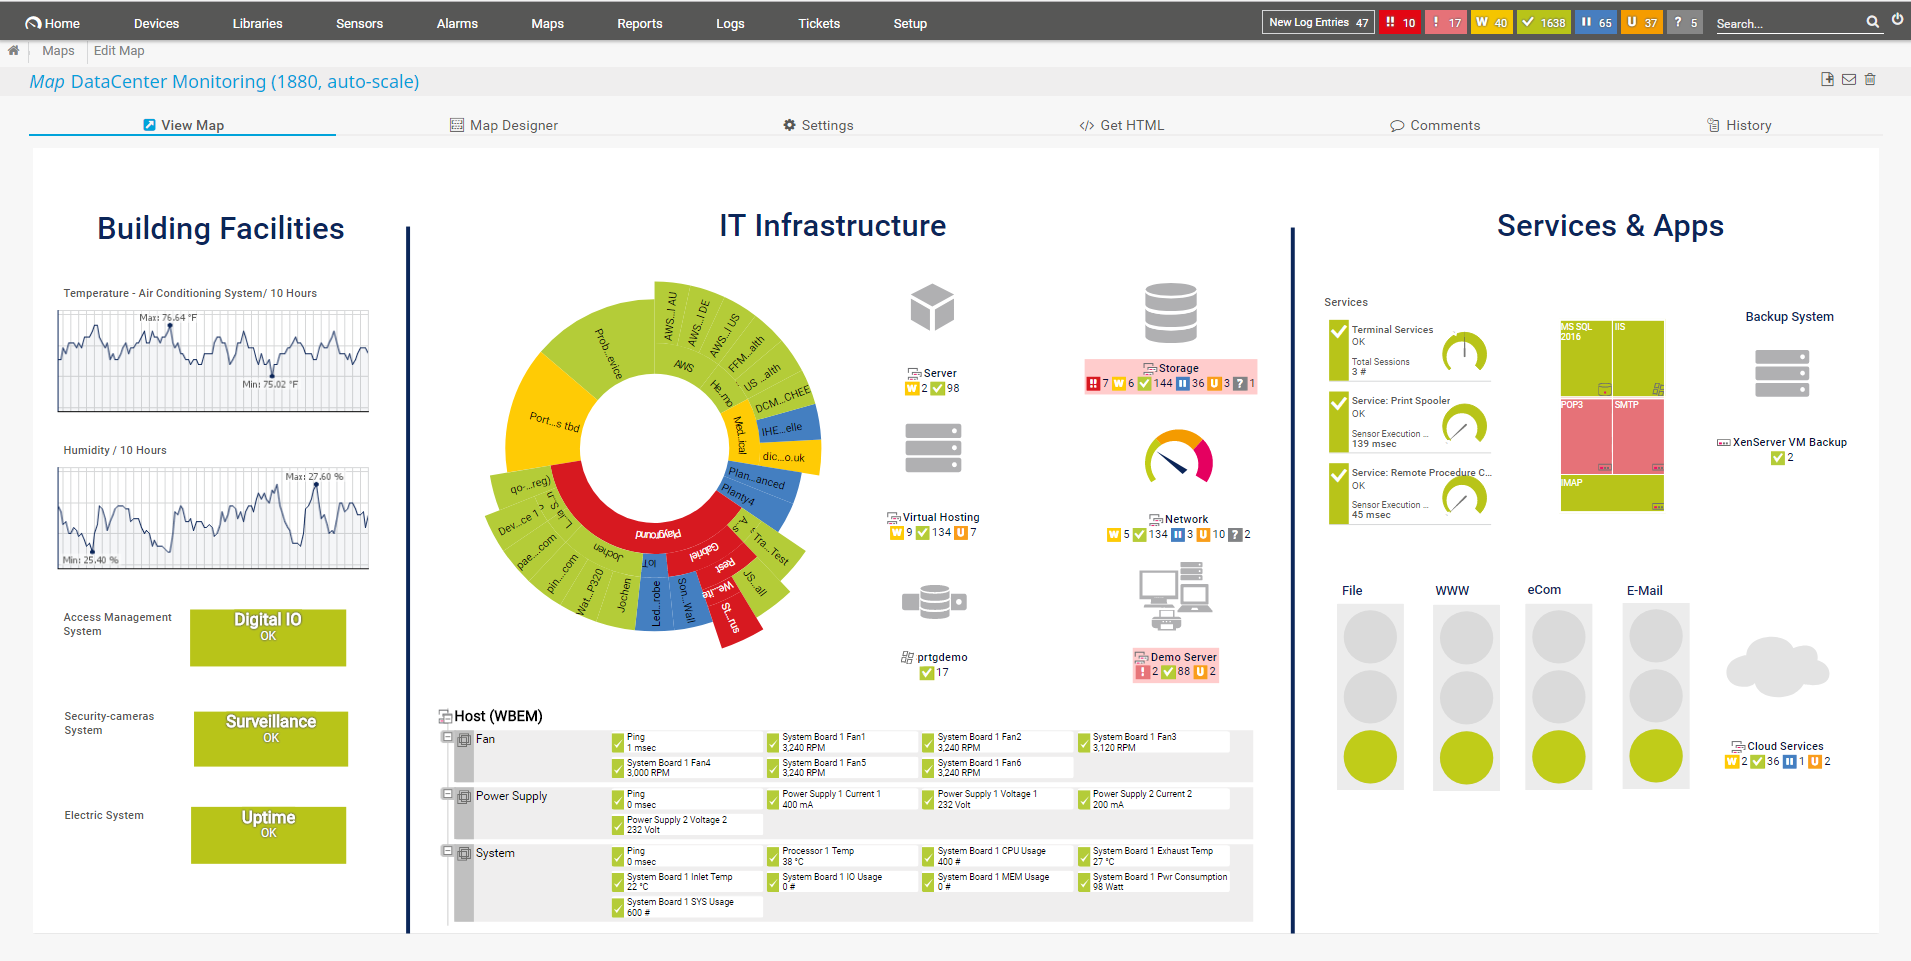
Build stunning network maps and real-time dashboards with drag-and-drop simplicity. Display on NOC screens or share with stakeholders.
Deploy remote probes in branch offices, data centers, or cloud regions. Manage everything from a single central console with full visibility.
Point PRTG at your network and watch it automatically find devices, create sensors, and start monitoring—often in minutes, not hours.
Generate professional PDF reports on uptime, SLA compliance, and capacity trends. Schedule automatic delivery to stakeholders.
Access PRTG from any device—web browser, desktop app, or native iOS/Android apps. Acknowledge alerts and drill into data on the go.
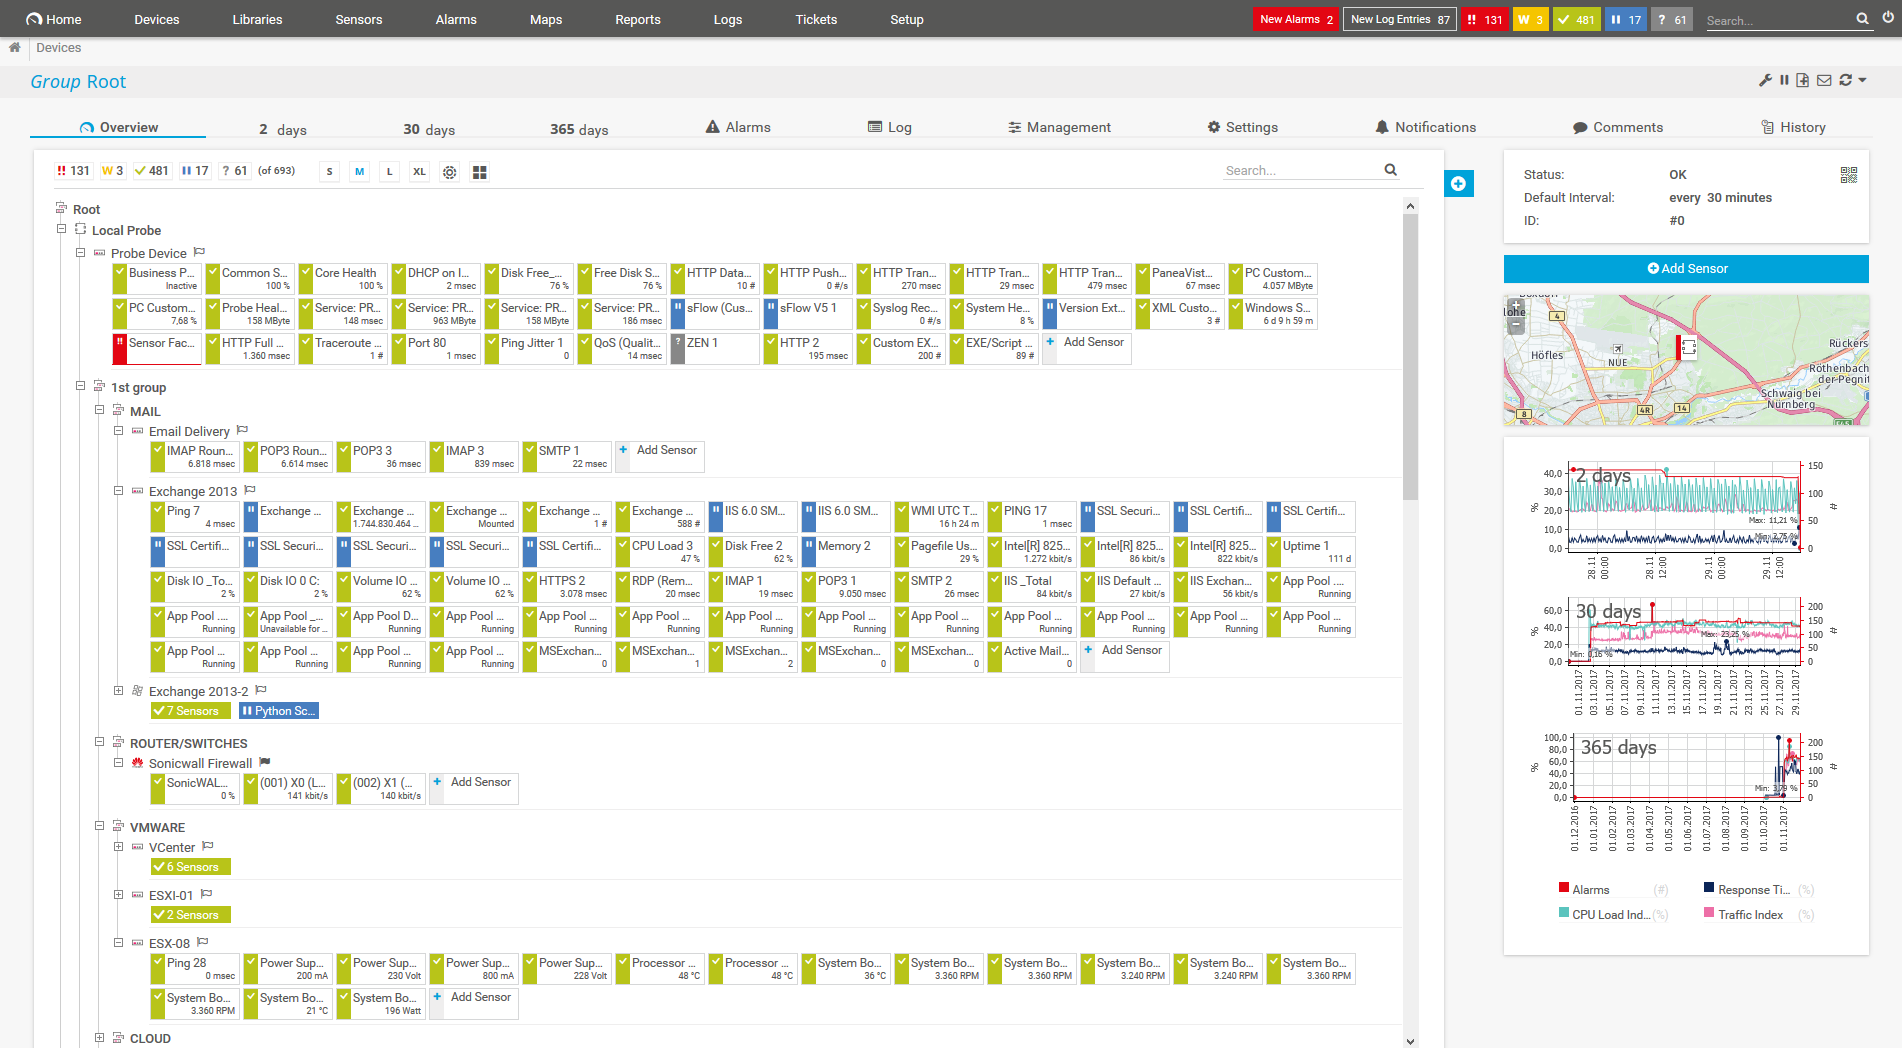
See your entire infrastructure in one unified dashboard. No more jumping between tools—monitor networks, servers, cloud, and apps from a single console.
Design your perfect monitoring experience. Create custom thresholds, build unique dashboards, and visualize data exactly how your team needs it.
Monitor beyond traditional IT. PRTG extends to operational technology, industrial systems, smart buildings, and IoT devices seamlessly.
Integrate with anything. Build custom sensors using scripts, query REST APIs, or connect to third-party systems. If it has data, PRTG can monitor it.
From small IT teams to global enterprises, PRTG scales effortlessly with a distributed architecture designed for any environment.
Central brain for data, config & alerting
Full control on your infrastructure
Deploy in your cloud environment
Best of both worlds
PRTG uses a straightforward sensor-based licensing model. Pay only for what you monitor.
Try PRTG Network Monitor completely free—forever. Get 100 sensors to monitor your most critical devices at no cost. No credit card required.
A sensor monitors one aspect of a device—like CPU, memory, bandwidth, or an application service.
Estimate your sensor needs based on typical deployments:
For very large environments with 10,000+ devices, consider PRTG Enterprise Monitor—a multi-server solution with ITOps Board for unified visibility across unlimited PRTG instances.
PRTG is designed for fast deployment. Most teams are up and running in under 30 minutes.
Install PRTG on a Windows server or VM—no complex prerequisites required.
PRTG automatically discovers devices and adds relevant sensors to start monitoring.
Adjust thresholds, add custom sensors, or remove noise to fit your needs.
Set up notifications and visualize your entire infrastructure in one view.
Add remote probes and sensors as your environment grows.
As the natural companion to PRTG, TaskCall adds the on-call rotation, automated escalation and noise-reduction layer. Through the webhook integration, sensor alarms reach the right owner within seconds — pushing your MTTR down to minutes.
Start with PRTG Network Monitor today. Get complete visibility into your IT infrastructure and prevent downtime before it impacts your business.
Fill out the form and our network monitoring experts will contact you to discuss your monitoring requirements and help you get started.
Find answers to common questions about PRTG Network Monitor, sensors, licensing, and deployment.
PRTG Network Monitor is an all-in-one infrastructure monitoring solution developed by Paessler AG. It monitors your entire IT environment including networks, servers, applications, cloud services, and IoT devices from a single dashboard. PRTG works by using industry-standard protocols like SNMP, WMI, SSH, and NetFlow to collect data from your devices without requiring agents. It installs on a Windows server and uses "sensors" to monitor individual metrics—each sensor tracks one aspect like CPU usage, bandwidth, or service availability. With over 250 built-in sensor types and the ability to create custom sensors, PRTG provides complete visibility into your IT infrastructure.
PRTG offers a free edition with 100 sensors that never expires—you get full functionality with no time limit and no credit card required. For larger deployments, PRTG uses sensor-based licensing with tiers typically at 500, 1,000, 2,500, 5,000, and 10,000+ sensors. Pricing is a one-time perpetual license fee plus annual maintenance (for updates and support). The cost varies by sensor count: expect approximately $1,750 for 500 sensors up to $15,000+ for 10,000 sensors. Enterprise organizations needing more than 10,000 sensors should consider PRTG Enterprise Monitor with custom pricing. All licenses include unlimited remote probes at no extra cost.
A sensor is PRTG's basic monitoring unit—each sensor monitors one specific metric such as CPU load, memory usage, bandwidth on a network port, or the status of a service. The number of sensors you need depends on how deeply you want to monitor your devices. Rule of thumb: approximately 10 sensors per device on average. For example: a Windows server typically uses 10-15 sensors (CPU, memory, disk, services), a network switch uses 5-50+ sensors depending on port count, and a VMware host might use 20-30 sensors. So an organization with 100 devices would typically need around 1,000 sensors, and 1,000 devices would need approximately 10,000 sensors.
PRTG differentiates itself from open-source alternatives like Nagios and Zabbix in several key ways: Ease of use—PRTG offers a polished GUI with auto-discovery, while Nagios requires significant configuration. All-in-one approach—one tool for network, server, application, and cloud monitoring vs. piecing together multiple solutions. Speed to value—most teams are monitoring within 30 minutes with PRTG. Commercial support—dedicated support team vs. community forums. However, Nagios and Zabbix are free open-source solutions, making them attractive for budget-constrained teams willing to invest time in setup. PRTG competes with commercial tools like SolarWinds, Datadog, and LogicMonitor by offering perpetual licensing (one-time cost vs. subscription) and on-premises deployment for data sovereignty.
Yes, PRTG provides comprehensive cloud monitoring capabilities. For Amazon Web Services (AWS), PRTG offers native sensors for EC2, CloudWatch, S3, ELB, RDS, and billing monitoring. For Microsoft Azure, you can monitor virtual machines, storage accounts, SQL databases, and Azure services via the Azure API and Azure Monitor integration. For Google Cloud Platform, PRTG supports monitoring through REST API sensors and custom scripts. You can also deploy PRTG remote probes inside your cloud environment (as EC2 instances or Azure VMs) to monitor cloud resources from within, reducing latency and providing inside-the-cloud perspective. This hybrid approach lets you monitor both on-premises and multi-cloud infrastructure from a single PRTG console.
PRTG Network Monitor runs on Windows Server 2016, 2019, or 2022 (64-bit). It can also run on Windows 10/11 for testing purposes. Hardware requirements scale with sensor count: for up to 2,500 sensors, you need a minimum of 4 CPU cores and 8GB RAM. For 5,000 sensors, recommend 8 cores and 16GB RAM. For 10,000+ sensors, consider 16+ cores, 32GB+ RAM, and SSD storage. PRTG can be deployed as a virtual machine on VMware, Hyper-V, or Citrix, and in cloud environments like AWS EC2 or Azure VMs. The PRTG core server requires approximately 200KB of disk space per sensor per day for historical data, so plan storage accordingly for long-term data retention.
Yes, PRTG excels at network and bandwidth monitoring. SNMP monitoring supports v1, v2c, and v3 (with encryption) for routers, switches, firewalls, printers, and any SNMP-enabled device. NetFlow/sFlow/jFlow sensors collect detailed traffic data from Cisco, Juniper, and other vendors, showing top talkers, protocols, and bandwidth trends. Packet sniffing sensors analyze traffic headers for deep inspection. PRTG also supports bandwidth monitoring via WMI for Windows, SSH for Linux, and QoS roundtrip sensors for latency and jitter measurement. You can set thresholds to alert when bandwidth usage exceeds limits, helping identify network bottlenecks and bandwidth hogs before they impact users.
Yes, PRTG's remote probe technology enables distributed monitoring across unlimited locations. You install a lightweight remote probe at each branch office, data center, or cloud region, and it connects back to your central PRTG core server via SSL. This allows monitoring behind firewalls without opening inbound ports or requiring VPN tunnels. All data is consolidated in one dashboard for unified visibility. Remote probes can also provide failover—if one probe goes down, others continue monitoring. For very large enterprises, PRTG Enterprise Monitor supports multiple core servers with an ITOps Board to federate data from thousands of probes across global infrastructure.
PRTG offers extensive alerting capabilities to ensure you're notified of issues immediately. Notification methods include: Email with customizable templates, SMS/text messages via gateways, Push notifications to iOS/Android PRTG apps, Slack and Microsoft Teams integration, HTTP webhooks for custom integrations, Syslog forwarding, and SNMP traps. Advanced alerting features include: dependency-aware alerts (avoid alert storms when a parent device fails), scheduled pause windows for maintenance, multi-stage escalation policies, and the ability to trigger custom scripts or execute commands automatically. You can set warning and error thresholds with separate notifications, and use state triggers to alert only after an issue persists for a specified duration.
Yes, PRTG scales to enterprise environments through two approaches. A single PRTG Network Monitor server can handle up to approximately 10,000-20,000 sensors depending on hardware resources and polling intervals. For larger environments, PRTG Enterprise Monitor is designed for unlimited scale—you deploy multiple PRTG core servers and use the ITOps Board to federate data into a unified view. Enterprise Monitor supports: unlimited sensors across unlimited locations, global dashboards aggregating data from all instances, centralized user management, and enterprise-grade features like LDAP/Active Directory integration and role-based access control. Many Fortune 500 companies and global enterprises with 50,000+ devices rely on PRTG for their infrastructure monitoring needs.
Download datasheets, guides, and technical documentation to learn more about PRTG Network Monitor.
Complete overview of PRTG features, sensor types, system requirements, and licensing options.
Open DatasheetStep-by-step instructions to install PRTG and start monitoring in under 30 minutes.
Open GuideComplete list of 250+ built-in sensors with configuration details and use cases.
Open ReferenceTechnical reference for PRTG REST API, custom sensors, and automation scripts.
Open DocsExpert recommendations for alerting, dashboard design, and performance optimization.
Browse KB