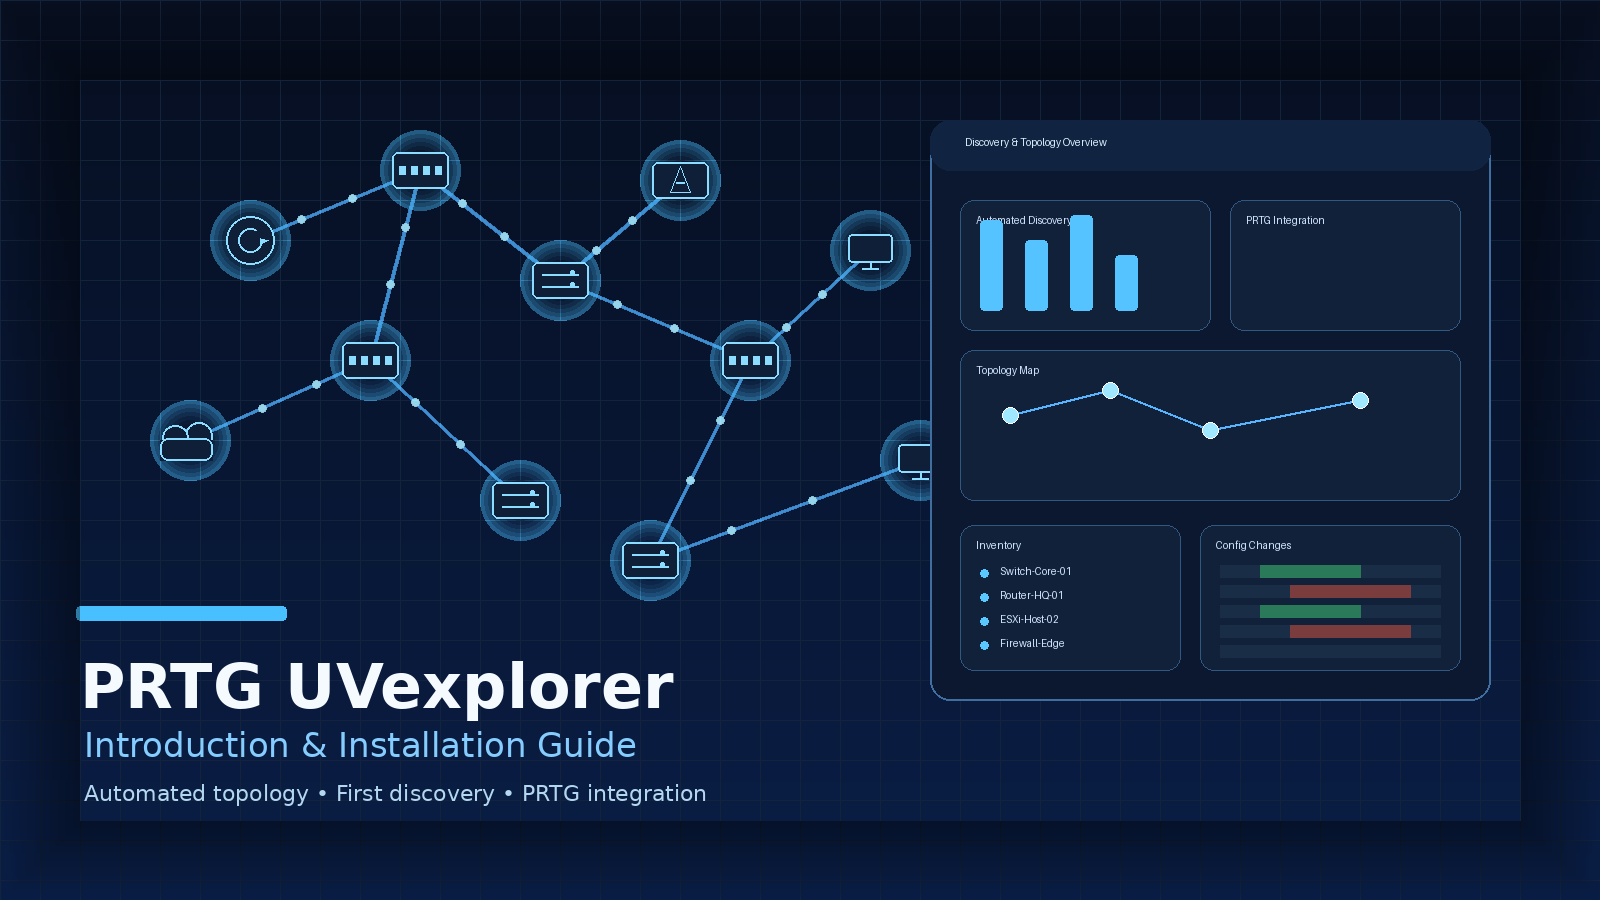
PRTG UVexplorer: Introduction & Installation Guide
Paessler PRTG UVexplorer: Introduction and First Installation Guide
Monitoring can tell an infrastructure team that a switch, router, server or service is unavailable. The next questions are often more difficult. How is that device connected? What sits upstream from it? Which systems depend on it? Has the topology changed since the last known-good state?
This context is critical during troubleshooting, but it is equally valuable for network documentation, inventory management, change management, audits and daily Network Operations Centre operations.
Traditional network diagrams frequently become outdated because ports move, switches are replaced, VLANs change, new systems are introduced and undocumented equipment appears. Maintaining these diagrams manually consumes engineering time and depends heavily on administrators updating documentation every time something changes.
Paessler PRTG UVexplorer is designed to address this gap. It automatically discovers network devices and their relationships, builds topology maps, collects network inventory information and adds dependency and configuration context to environments monitored by PRTG.
The key point is that UVexplorer does not replace PRTG.
PRTG remains responsible for continuous availability and performance monitoring, sensors, thresholds, notifications, historical data and dashboards. UVexplorer complements that monitoring layer by providing deeper information about how the network is structured and how its components are connected.
What Is Paessler PRTG UVexplorer?
PRTG UVexplorer is an on-premises, Windows-based network discovery and automated topology mapping solution. It can discover network devices, identify physical and logical relationships, collect inventory information and generate maps that represent connectivity down to interface or port level when the necessary information is available from the devices.
The product became part of Paessler's portfolio after Paessler GmbH acquired UVnetworks, the developer of UVexplorer and UVexplorer Server, on 26 May 2026. The integrated solution is now positioned as Paessler PRTG UVexplorer.
UVexplorer remains a separately installed Windows application rather than a PRTG sensor. It communicates with network devices directly for discovery and can then integrate the resulting topology, inventory and device information with PRTG.
This creates a clear operational separation.
PRTG answers questions such as whether a device is available, how its interfaces are performing, whether CPU utilisation is abnormal or whether a service has crossed a defined threshold.
UVexplorer focuses on questions such as how devices are connected, what exists upstream and downstream, which ports form the physical relationship, what assets were discovered and what may have changed in the network topology or device configuration.
Used together, the two products provide both monitoring evidence and network context.
Why Network Topology Context Matters
Consider an access switch already monitored by PRTG.
If the switch becomes unavailable, PRTG can immediately change its status to Down and notify the responsible team. That is exactly what a monitoring platform should do.
However, the engineer may still need to determine which distribution switch feeds the affected switch, which physical interface is being used as the uplink, which devices are connected behind it and whether anything in the topology or configuration changed before the incident.
If current documentation is unavailable, this investigation can turn into a manual process involving switch CLI sessions, MAC address tables, ARP tables, CDP or LLDP information, interface descriptions, old Visio diagrams and conversations with other engineers.
UVexplorer is designed to reduce this dependency on manually reconstructed network context.
It is particularly useful in environments where topology documentation becomes outdated quickly, Layer 2 relationships are difficult to maintain manually, endpoints move between switchports or infrastructure changes occur more frequently than diagrams are updated.
A topology map created once is still only a snapshot. The real operational value comes from periodically rediscovering the environment and allowing the documented network model to follow the actual network as it changes.
Automated Network Discovery
UVexplorer uses common infrastructure management protocols and technologies to discover devices and retrieve information from them.
These include ICMP, SNMP, WMI, SSH and Telnet, together with platform-specific methods such as the VMware VIM API.
A simple Ping response can confirm that an address is reachable, but reachability alone does not provide the information required to build a detailed network topology.
Authenticated discovery provides considerably more value.
With appropriate credentials, UVexplorer can retrieve device identity information, interfaces, VLAN information, bridge data, operating-system details, hardware information and other attributes that improve both inventory accuracy and topology quality.
For routers and switches in particular, SNMP plays an important role in collecting the information required for detailed Layer 2 and Layer 3 relationship discovery.
Layer 2 and Layer 3 Topology Mapping
One of the central capabilities of PRTG UVexplorer is automated Layer 2 and Layer 3 topology discovery.
Layer 3 visibility helps administrators understand routed relationships between devices and networks. Layer 2 visibility adds the switching context that IP-level monitoring alone cannot provide.
This distinction matters operationally.
A device might be reachable through an IP address, but that does not immediately tell an engineer which access switch it is connected to, which switchport is involved or how the local switching path reaches the rest of the network.
Where sufficient discovery information is available, UVexplorer can identify these relationships and represent them visually.
This makes the resulting map far more useful than a manually drawn diagram that may no longer represent the live environment.
Port-Level Connectivity
UVexplorer can also provide physical connectivity information at interface or port level when the monitored devices expose the required information.
This allows engineers to move beyond simply knowing that two devices communicate with each other.
They can investigate which ports form the relationship, how switches connect to one another and where downstream infrastructure is attached.
This can be particularly useful during outage investigation, network migration, switch replacement, access-layer troubleshooting and capacity planning.
Network Inventory
Topology is only one part of UVexplorer's value.
The discovery process also creates an inventory of the environment.
Depending on the device and the protocols available, this information can include manufacturer, model, serial number, hostname, IP address, MAC address, interfaces, operating-system information, software details and device-specific attributes.
This creates a useful secondary source of infrastructure visibility alongside the monitoring objects already configured in PRTG.
It can also expose devices that exist on the network but have not yet been included in the monitoring platform.
Dependency Visibility
UVexplorer can help administrators understand upstream and downstream relationships based on the latest successful topology discovery.
This is particularly useful during incident investigation.
If a monitored switch fails, an engineer can inspect the topology to understand which infrastructure appears above the device and which discovered systems are connected below it.
This should not be interpreted as automatic root-cause analysis.
Topology is evidence.
It provides additional context that helps the engineer narrow the investigation and assess possible impact, but the topology itself does not automatically prove why a failure occurred.
PRTG sensor data, logs, device diagnostics and other operational evidence are still required to determine the actual cause of an incident.
Configuration Backup and Change Tracking
UVexplorer can also collect configuration information from supported network devices.
Configuration snapshots can be captured during one-time or scheduled discovery processes and later compared with previous versions.
This adds an important change-management dimension to the topology information.
If an incident occurs after a configuration modification, engineers may be able to review previous and current device configurations and identify relevant changes around the incident timeframe.
SSH credentials are required for documented configuration-backup workflows, so this functionality should be deployed with carefully controlled discovery accounts and appropriate security policies.
Scheduled Discovery
Networks change continuously.
New devices appear, interfaces move, switch uplinks change, VLAN assignments are modified and infrastructure is replaced.
For this reason, UVexplorer supports scheduled discoveries that repeat the discovery process and update the stored network information.
This allows the topology to evolve with the environment rather than remaining a static representation of how the network looked when the original discovery was performed.
Scheduled discovery can also be combined with the PRTG integration so updated discovery information can be reflected in the broader monitoring workflow.
PRTG Maps and UVexplorer Are Not the Same Thing
It is important to distinguish UVexplorer topology from native PRTG Maps.
PRTG Maps are designed primarily as custom monitoring dashboards. Administrators can place devices, sensors, graphs, tables, status information, images and connection lines into layouts that present monitoring information in a useful operational format.
They are highly valuable for NOC screens, service dashboards, management views and application-specific monitoring pages.
However, native PRTG Maps are not an automated Layer 2 or Layer 3 network discovery engine.
PRTG Auto-Discovery is also a separate concept.
PRTG Auto-Discovery scans the network, identifies devices and automatically creates suitable sensors according to device templates and discovered capabilities.
UVexplorer discovery focuses on network structure, connectivity, topology, inventory and relationships.
In practical terms, PRTG Maps present monitoring information, while UVexplorer discovers the underlying network structure that can be used to create or enrich topology views.
How PRTG and UVexplorer Work Together
A combined deployment creates two complementary data flows.
UVexplorer communicates with network devices through protocols such as ICMP, SNMP, WMI and SSH. From this communication it builds topology information, connectivity relationships, inventory records and, where supported, configuration snapshots.
PRTG also communicates with infrastructure devices, but its objective is different. It continuously collects monitoring data such as availability, interface traffic, CPU utilisation, memory usage, service status and other performance metrics.
UVexplorer can then export discovered devices, groups and topology information to PRTG. Administrators can also choose to create selected monitoring sensors during the export process.
The integration works in the opposite direction as well. UVexplorer can query PRTG device state so operational statuses such as Up or Down can be represented within UVexplorer views.
This allows an engineer to combine the live monitoring state from PRTG with the discovered connectivity context from UVexplorer.
System Requirements
As of 24 August 2026, the current stable UVexplorer release is version 2.0, Build 2.0.144, released on 3 August 2026.
Because software versions change, the current build should always be checked on the official download page before beginning a new deployment.
UVexplorer is a Windows-based application.
The current technical information lists support for Windows Server 2025, Windows Server 2019, Windows Server 2016 and Windows Server 2012, together with Windows 11, Windows 10, Windows 8 and Windows 7.
Some of these operating systems are already outside their normal Microsoft support lifecycle. A platform appearing on the UVexplorer compatibility list does not automatically make it a suitable choice for a new production deployment.
For a new installation, use a Windows version that is supported both by UVexplorer and by your organisation's operating-system lifecycle and security policies.
The current minimum system requirements specify a 2 GHz processor, 8 GB of memory, 8 GB of available disk space, a 100 Mbps network interface, a minimum display resolution of 1024 × 768 and .NET Framework 4.5.2 or later.
These should be treated as minimum requirements rather than universal sizing recommendations.
The actual resources required will depend on network size, discovery frequency, the number of devices, collected information and how extensively features such as configuration backup are used.
UVexplorer can also be deployed on a virtual machine, which is typically the most practical approach in enterprise environments.
Where Should UVexplorer Be Installed?
UVexplorer can be deployed on a Windows VM, another standalone Windows system or, where appropriate, on the PRTG Core Server.
For a small proof of concept, using an existing Windows test system with good reachability to the target network can provide the fastest path to initial discovery.
For production environments, a dedicated Windows VM is often a cleaner architectural choice.
Separating UVexplorer from the PRTG Core Server isolates discovery workload, stored credentials, software lifecycle management and security controls from the central monitoring server.
This is not a mandatory Paessler architecture, but it is worth considering for medium and large environments.
The deployment location should also provide suitable network reachability to the infrastructure being discovered.
Discovery traffic should not require unnecessarily broad firewall rules. Only the management protocols required for the intended discovery methods should be permitted between the UVexplorer host and the relevant infrastructure.
Larger or geographically distributed networks should also evaluate UVexplorer Server, which is designed for larger environments and distributed discovery using UVexplorer agents.
Downloading PRTG UVexplorer
UVexplorer is currently available through both an Internet-connected installer and a larger offline installation package.
The Internet-connected installer is suitable when the Windows host is permitted to communicate with the vendor's installation infrastructure.
The offline ZIP package is more suitable for restricted, staged or isolated environments.
Before deployment, confirm the latest stable release, select the correct installation method and obtain the appropriate trial or production activation key.
Installation media should only be obtained from official Paessler or UVexplorer infrastructure.
In controlled enterprise environments, installer integrity and digital signatures should also be validated according to the organisation's normal software-deployment process.
Offline and manual activation options are available for environments where the UVexplorer system cannot directly access the Internet.
Installing UVexplorer for the First Time
The first installation should begin with a properly prepared Windows host.
Confirm that the operating system, memory, disk capacity, .NET installation and network connectivity meet the current requirements. The Windows account being used for installation must also have sufficient privileges to install enterprise software.
Run the downloaded UVexplorer installer and follow the interactive installation wizard.
Review the installation location presented by the current installer and change it only where required by internal software-management standards.
After the installation process completes, launch UVexplorer and open the Start Page.
The product can then be activated using the trial or production key assigned to the deployment. For Internet-connected systems, UVexplorer can contact the licensing service directly. Offline environments can use the documented manual activation process.
Once activation is complete, check the installed product version and confirm that the expected release has been deployed.
At the time of writing, that release is Build 2.0.144.
Initial Configuration
Do not begin by scanning the entire production environment.
A better first deployment starts with a controlled subnet or IP range that contains several representative devices.
This makes it easier to verify credentials, connectivity, classification and topology quality before the discovery scope is expanded.
Create a clearly identifiable discovery configuration for the test environment.
Within the protocol and credential settings, configure only the credentials required for the devices in that scope.
For network infrastructure, SNMP will usually provide an important part of the topology and inventory information.
SNMPv3 should be preferred where supported and compatible with organisational security policies because it provides stronger authentication and privacy capabilities.
If SNMPv2c is required, use a dedicated non-default read-only community and restrict which management systems are allowed to query the devices.
Windows environments can use WMI where deeper Windows inventory is required. SSH can be configured where device access or configuration-backup functionality depends on it.
Avoid reusing highly privileged administrative credentials simply because they are convenient.
Discovery credentials should be dedicated to the purpose and follow least-privilege principles wherever possible.
Running the First Network Discovery
For the first controlled discovery, open the Network Discovery wizard from the UVexplorer Start Page.
A Ping Sweep provides a practical starting point for the introductory discovery workflow.
Define the IP range that should be examined and associate the appropriate discovery credentials with the scan.
Where Windows systems are included, select the level of Windows inventory required for the test.
Review the discovery configuration carefully before starting the process.
When the discovery is complete, open the results and examine what UVexplorer has identified.
The objective of the first scan is not simply to complete successfully.
The objective is to validate that UVexplorer is discovering the environment accurately enough to be trusted before expanding the scope.
Validating Discovery Results
After the first scan, compare the discovery results with what you already know about the environment.
Expected routers and switches should appear. Hostnames and IP addresses should make sense. Network-device classifications should be reasonable. Interfaces should be populated where the required information is available.
Most importantly, inspect the topology.
Known uplinks and relationships should correspond with the real infrastructure.
If devices are missing, start by checking reachability and credentials.
If devices are discovered but topology information is incomplete, SNMP access is one of the first areas to investigate, particularly for routers and switches.
Partial discovery can occur when SNMP is disabled, credentials are incorrect, ACLs or firewalls block management access, segmentation prevents the UVexplorer host from reaching a target network or the configured discovery range does not include the expected addresses.
A device appearing in the discovery results does not automatically mean that every possible detail about that device has been collected.
Unauthenticated or partially authenticated discovery will naturally produce less information than a properly configured authenticated discovery.
Understanding the Topology Map
Once discovery quality has been validated, examine the automatically generated topology.
Identify core and routing devices, distribution switches, access switches, uplinks, downstream devices and interface-level relationships.
This is where the operational value of UVexplorer becomes easier to see.
Suppose PRTG reports that an access switch has gone Down.
The PRTG alert gives the engineer the monitoring evidence.
UVexplorer can provide the connectivity context by showing how the affected switch is connected, what exists upstream and which discovered systems appear downstream.
The combination immediately gives the engineer more information than either monitoring or topology could provide independently.
It is still important not to mistake this for automatic root-cause analysis.
UVexplorer is helping to answer where the device sits and what may depend on it. Further investigation is still required to determine why the device failed.
Connecting UVexplorer to PRTG
PRTG integration should only be configured after the initial discovery has been validated.
Begin with a small test export rather than attempting to synchronise a large production network immediately.
The integration is initiated through the Export to PRTG function in UVexplorer.
The export process requires the destination PRTG server information and the appropriate authentication details.
A typical configuration will use the HTTPS address of the PRTG server together with a PRTG username and its associated passhash for API authentication.
After connectivity is established, UVexplorer can be used to select the destination PRTG group, choose discovered devices for export and optionally export topology content.
Selected sensor types can also be created as part of the workflow.
This capability should be used carefully.
Do not automatically enable every available sensor merely because UVexplorer can create it.
Existing PRTG environments often have carefully designed monitoring standards, sensor budgets and device structures. Uncontrolled sensor creation can generate unnecessary monitoring objects, increase sensor consumption and introduce duplicate monitoring.
The safest approach is to export a small group of devices first and enable only the sensors required for the intended monitoring policy.
Verifying the Integration
After the first test export, verify both sides of the integration.
Confirm that UVexplorer can successfully authenticate to PRTG and that the selected devices appear in the intended PRTG group.
Check that exported topology information appears where expected and that only the monitoring sensors you deliberately selected were created.
Existing devices and sensors should also be checked to ensure that the export has not introduced unwanted duplicates.
If PRTG Monitor functionality is enabled in UVexplorer, verify that PRTG device state can be queried successfully and represented in UVexplorer views.
This small-scale validation is particularly important before a larger synchronisation.
Bulk creation of devices and sensors can significantly affect the object hierarchy and sensor consumption of an established PRTG system.
Common First-Installation Problems
If no devices are discovered, verify the configured IP scope and basic network reachability from the UVexplorer server.
If some switches are missing, confirm that the expected SNMP version is enabled and that the discovery credentials are correct.
If devices are discovered but the topology is incomplete, investigate whether UVexplorer is receiving enough information from the routers and switches to build the relationships.
If the inventory information is very limited, the scan may effectively be operating without the authenticated access required for deeper discovery.
Review the configured SNMP, WMI and SSH credentials according to the device types being scanned.
Missing Layer 2 links can indicate that bridging or topology information cannot be retrieved from the network devices.
Configuration-backup failures should be investigated from the SSH side first, including the credentials, device support and access permissions.
If the PRTG connection fails, verify the PRTG URL, username and passhash.
If an export unexpectedly creates a large number of sensors, reduce the scope and select only the monitoring templates and sensor types that are actually required.
Scheduled discoveries should also be checked if expected changes do not appear. Confirm that the schedule is active, the discovery configuration remains valid, credentials still work and the UVexplorer host is available when the scheduled job executes.
Security Best Practices
A network discovery and topology platform contains information that is highly valuable to administrators, but that same information would also be useful to an attacker.
The UVexplorer host should therefore be treated as management infrastructure.
Administrative access to both the Windows host and the application should be restricted.
Use dedicated discovery accounts and least-privilege access wherever possible.
Read-only SNMP access is generally sufficient for discovery, and SNMPv3 should be preferred where compatible with the environment.
WMI and SSH credentials should be protected carefully.
Highly privileged domain or network administrator credentials should not be reused for discovery simply to simplify configuration.
Discovery should also be restricted to approved network ranges.
Management-plane access should continue to be controlled through firewalls, ACLs and existing segmentation policies rather than opening broad access specifically for the discovery platform.
UVexplorer, PRTG and the underlying Windows platform should all remain within the organisation's patching and lifecycle-management processes.
New or unknown assets discovered by UVexplorer should also be reviewed periodically.
Unexpected discovery results can sometimes reveal infrastructure that has not been formally documented or incorporated into the normal monitoring process.
UVexplorer should not be confused with a vulnerability scanner, SIEM, IDS, IPS, NDR or EDR platform.
Its primary value is network discovery, topology, inventory, dependency visibility and configuration context. Security monitoring and vulnerability assessment still require dedicated security controls.
A Practical First-Day Deployment Approach
A successful first deployment should be deliberately conservative.
Install UVexplorer on an approved Windows system and activate the trial or production licence.
Configure only the credentials required for a small test environment.
Run the first discovery against a controlled subnet and validate both the inventory and the Layer 2 and Layer 3 relationships.
Resolve any reachability, SNMP, WMI or SSH issues before expanding the scan.
Once the topology is reliable, configure the PRTG connection and export a small group of devices.
Verify the resulting devices, maps and sensors inside PRTG before enabling any wider synchronisation.
After the manual workflow is understood, configure an appropriate discovery schedule and gradually expand the scope into additional networks.
This staged approach makes credential problems, topology gaps, duplicate objects and unexpected sensor consumption much easier to detect before they affect a production-scale monitoring environment.
Example Deployment Scenario
Consider a manufacturing organisation with a headquarters site, two branch offices and approximately 150 infrastructure devices including switches, routers, firewalls, Windows servers and virtualisation hosts.
PRTG is already responsible for monitoring device availability, interface utilisation, CPU and memory usage, service health and other operational metrics.
The infrastructure team deploys UVexplorer on a Windows VM with management access to the headquarters network.
Instead of discovering all locations immediately, the administrator begins with the core and access-switch environment using approved read-only management credentials.
UVexplorer discovers the network devices, identifies switch relationships and creates the initial topology.
The administrator reviews the resulting inventory and confirms that known uplinks and device relationships are represented correctly.
Only after this validation is a small group of tested infrastructure devices exported to PRTG.
Later, PRTG reports that an access switch has gone Down.
The engineer sees the monitoring alert and then uses the UVexplorer topology to understand the switch's upstream relationship and the infrastructure connected behind it.
Available topology history or configuration snapshots can then provide further context around changes that occurred close to the incident.
PRTG answers the operational question: “What is failing and how is it performing?”
UVexplorer adds another set of questions: “How is it connected, what may depend on it and what changed?”
That combination is where the real value of the integration becomes visible.
Why Existing PRTG Administrators Should Evaluate UVexplorer
For an existing PRTG team, the strongest reason to evaluate PRTG UVexplorer is not the addition of another monitoring screen.
It is the ability to reduce how much network context engineers need to reconstruct manually.
Automated topology can reduce the effort required to maintain diagrams.
Port-level and dependency information can shorten connectivity investigations.
Network inventory can provide another source of truth against the devices already being monitored.
Configuration history can provide useful evidence when a problem begins immediately after a network change.
Most importantly, these capabilities can complement a monitoring platform the operations team already understands.
PRTG continues to provide sensors, monitoring, alerts, notifications, historical data and operational dashboards.
UVexplorer adds the network structure around that monitoring information.
Frequently Asked Questions
Does PRTG UVexplorer replace PRTG?
No.
UVexplorer complements PRTG with automated discovery, topology, inventory, dependency information and configuration context.
PRTG remains the primary platform for continuous infrastructure availability and performance monitoring.
Is UVexplorer included with every PRTG licence?
Do not assume that a PRTG licence automatically includes UVexplorer.
Commercial entitlement should be confirmed according to the relevant Paessler quotation, subscription or contract.
Does UVexplorer require a separate server?
Not necessarily.
UVexplorer is a separate Windows application, but it can be installed on a Windows VM, a standalone Windows host or, where suitable, the PRTG Core Server.
For larger environments, a dedicated VM can provide better separation of workload, credentials and lifecycle management.
Can UVexplorer run in a virtual machine?
Yes.
Virtual-machine deployment is supported and is often the most practical architecture for enterprise installations.
Does UVexplorer automatically create network maps?
Yes.
Automated topology discovery and mapping are core capabilities of the platform, including Layer 2, Layer 3 and port-level relationships where the required information can be collected.
Can discovered devices be added to PRTG?
Yes.
UVexplorer can export discovered devices and topology information to PRTG and can optionally create selected monitoring sensors.
Sensor creation should be controlled carefully in existing environments.
Does UVexplorer require SNMP?
Not for every discovery function.
However, SNMP is particularly important for retrieving the detailed information required to build router and switch topology.
A device may still be discovered without SNMP while providing far less useful topology and inventory information.
Should SNMPv2c or SNMPv3 be used?
SNMPv3 should generally be preferred when supported because it provides stronger authentication and privacy capabilities.
Where SNMPv2c must be used, configure unique read-only communities and restrict management access to authorised systems.
Can UVexplorer operate without Internet access?
Yes.
An offline installation package and manual activation workflow are available.
Internal network discovery itself does not inherently require public Internet access, although online activation, update checks and other Internet-based services naturally require connectivity.
How often should discovery run?
There is no single schedule suitable for every environment.
Discovery frequency should reflect network size, infrastructure change rate, operational requirements and the load generated by the discovery process.
During the initial implementation, running discovery at controlled intervals or during off-hours makes validation easier.
Once the behaviour and impact are understood, the schedule can be adjusted according to the environment.
Conclusion
PRTG UVexplorer fills an important operational gap between knowing that a device has failed and understanding where that device sits within the network.
PRTG provides the continuous monitoring layer administrators rely on for availability, performance metrics, sensors, alerts, notifications and historical visibility.
UVexplorer adds automated topology, network inventory, dependency relationships, configuration snapshots and change context.
Used together, they allow an engineer to move beyond a simple “this device is Down” alert and investigate where the affected device is located in the topology, what may depend on it and whether relevant changes occurred around the same time.
For a first deployment, start small.
Install the current release on an appropriate Windows system, configure least-privilege discovery credentials, discover one controlled network segment and validate the resulting inventory and topology.
Only after the discovery results are trusted should the PRTG export workflow be introduced.
For organisations already using PRTG, this creates a practical extension of the monitoring environment: PRTG shows what is happening, while UVexplorer helps explain how the affected infrastructure fits together.
CyberDistro can support organisations evaluating Paessler PRTG UVexplorer with architecture planning, proof-of-concept deployments, PRTG integration and technical implementation.