
Monitoring Web and Application Servers with PRTG: A Practical Approach for Modern IT Infrastructures
In modern enterprise IT environments, the availability of applications and web services is one of the most critical components of operational continuity. Today, it is no longer sufficient for a server to simply be running; the services, applications, and APIs hosted on that server must also respond reliably and perform as expected.
This is where Paessler PRTG Network Monitor provides significant value. With its sensor-based architecture, PRTG enables organisations to monitor infrastructure, servers, and applications from a single unified platform.
Monitoring Servers and Applications with PRTG
PRTG’s flexible monitoring model allows different layers of a server environment to be observed independently. This enables IT teams to verify not only whether the infrastructure is available, but also whether the applications running on top of it are functioning properly.
A typical monitoring scenario using PRTG may include visibility into:
-
Server availability and connectivity
-
CPU and memory utilization
-
Disk capacity and I/O performance
-
Network interface traffic
-
Application services and processes
-
Web application response times
By consolidating these metrics into a single monitoring platform, IT operations teams gain comprehensive visibility into system health and performance.
Monitoring Web Applications with HTTP Sensors
User experience in modern web applications largely depends on application availability and response performance. PRTG’s HTTP sensors allow organizations to monitor web services and API endpoints in detail.
Using HTTP-based monitoring, organizations can track:
-
Web service availability
-
HTTP response time
-
Status code validation
-
Presence of specific content or keywords
-
SSL certificate status
This approach ensures that monitoring goes beyond simple uptime checks and verifies whether the application is actually responding correctly from an end-user perspective.
Monitoring Windows Servers with WMI Sensors
For Windows-based environments, WMI sensors provide deep insight into operating system performance and server health. These sensors allow administrators to track critical system metrics such as:
-
CPU load
-
Memory utilization
-
Disk performance
-
Windows service status
-
Event log activity
WMI monitoring is particularly useful in environments where enterprise applications run as Windows services, providing detailed operational visibility.
A Layered Approach to Application Monitoring
Effective application monitoring typically follows a layered structure:
Infrastructure Layer
Monitoring CPU, memory, disk usage, and network performance.
Service Layer
Tracking application services, background processes, and system components.
Application Layer
Validating web endpoints, API responses, and database queries.
By combining these layers, organizations can detect issues faster and perform root cause analysis more efficiently.
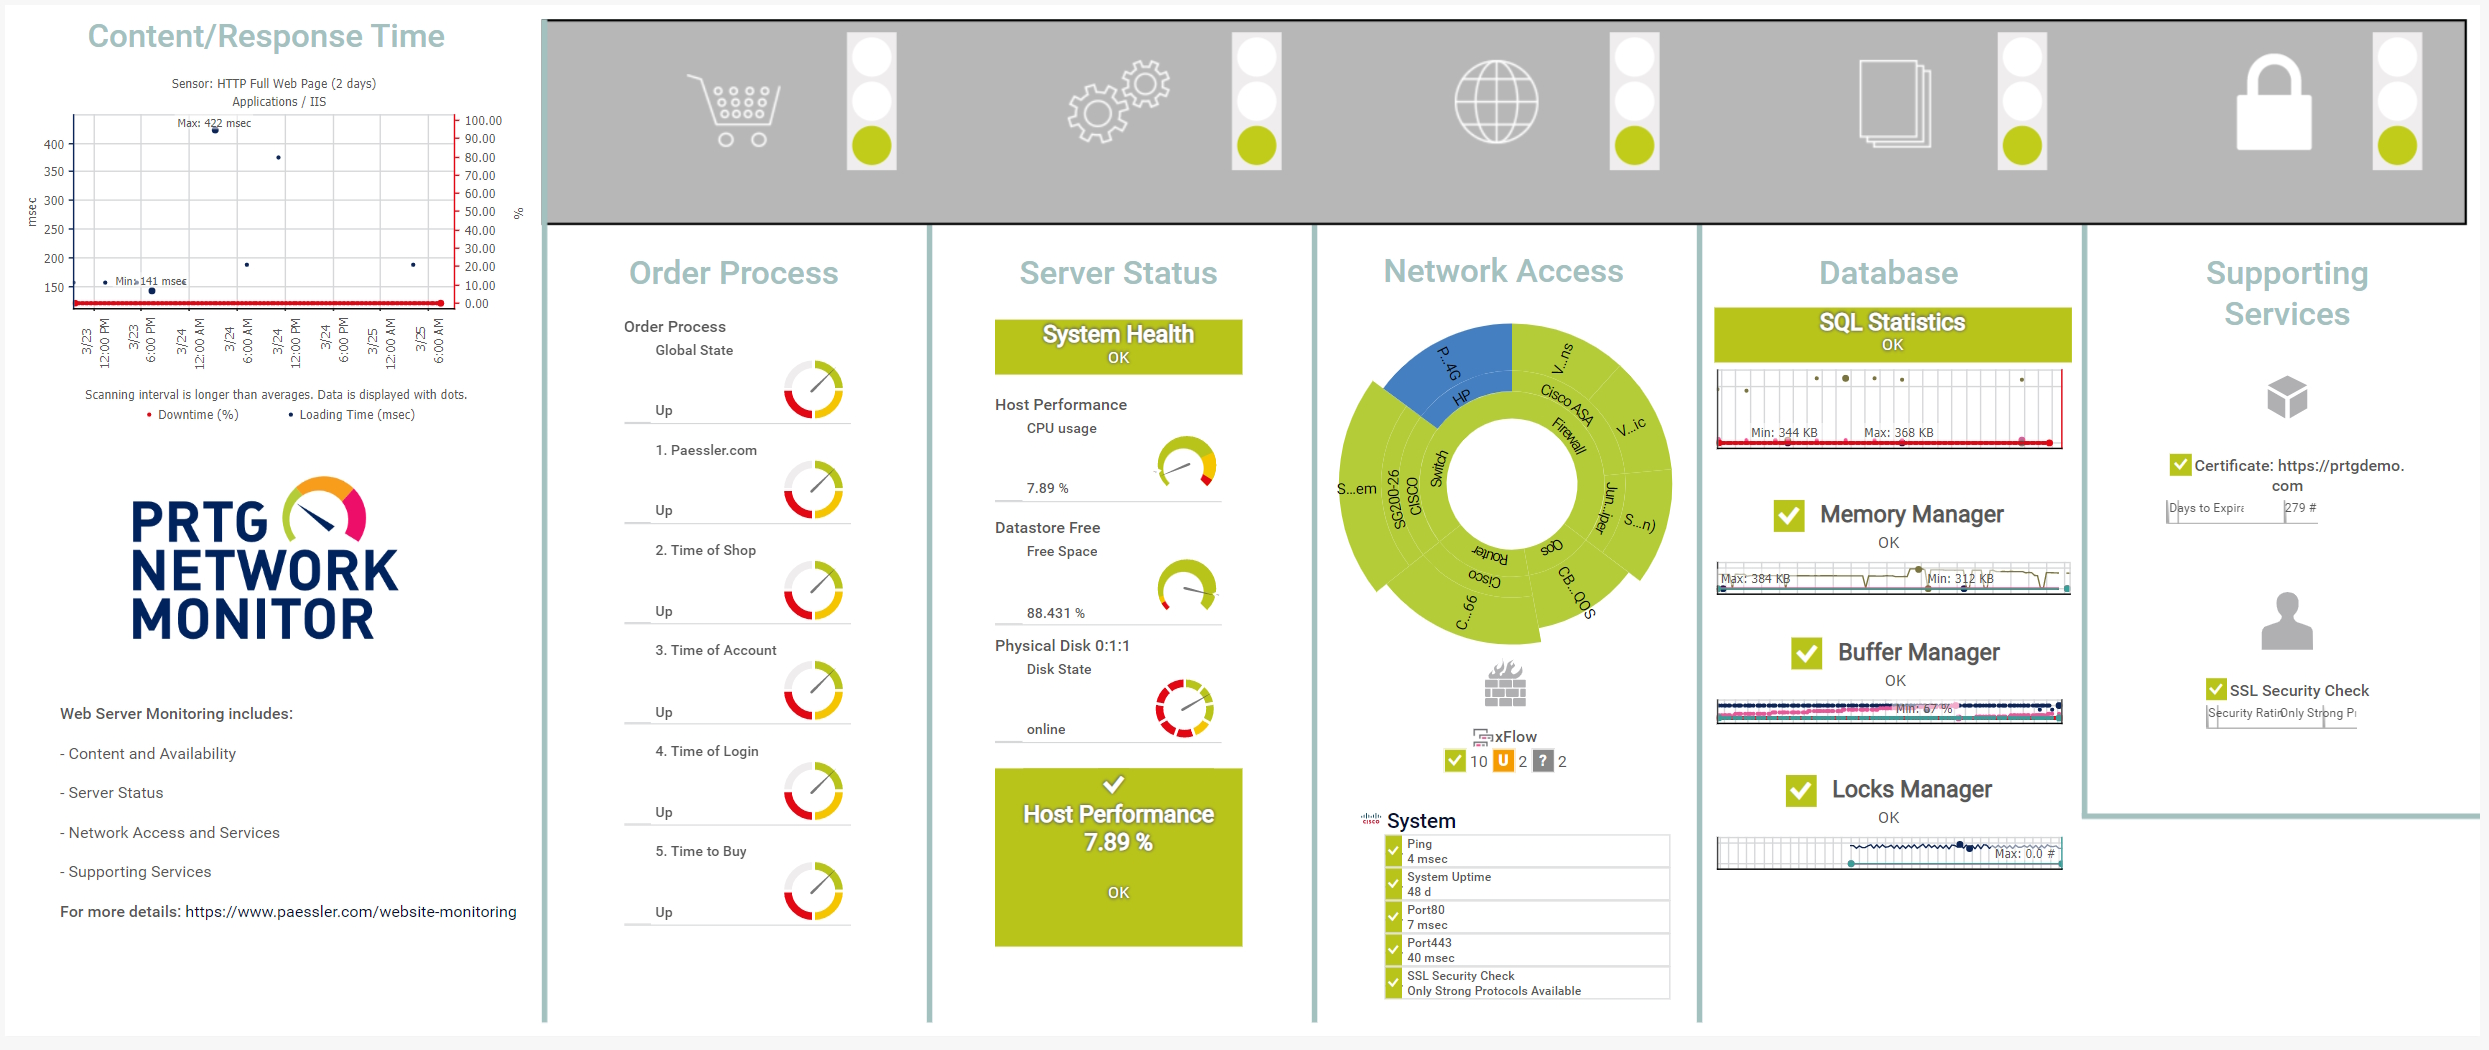
Centralized Dashboards and Alerting
PRTG consolidates monitoring data into centralized dashboards that allow operations teams to visualize system health in real time. These dashboards can display key infrastructure metrics, application performance indicators, and active alerts in a single interface.
In addition, PRTG provides configurable alerting mechanisms. When defined thresholds are exceeded or services become unavailable, automated notifications can be triggered to inform the appropriate teams and initiate response actions.
Conclusion
As IT environments become more complex, having a comprehensive monitoring strategy is essential for maintaining operational stability and service reliability. PRTG Network Monitor offers a powerful and flexible platform that enables organizations to monitor servers, applications, and services from a single solution.